We help Lakes Region retailers turn transactions and foot traffic into smarter inventory, better staffing, and stronger customer loyalty.
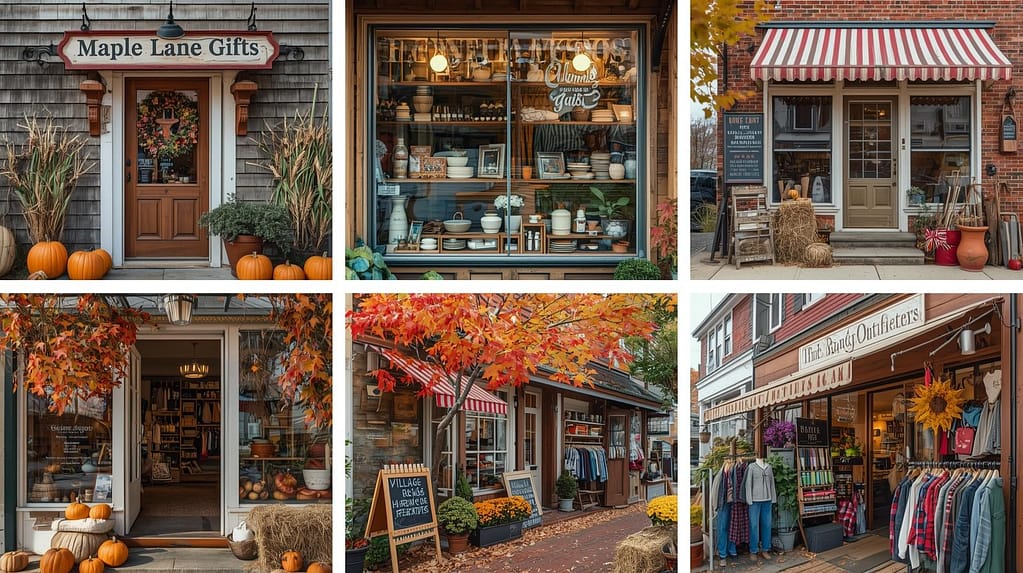
Whether you run a boutique, gift shop, general store, or specialty retail outlet, your business thrives on timing, trends, and repeat customers. Lakes Region Analytics transforms your POS data, staffing schedules, and customer behavior into clear dashboards that help you manage inventory, optimize labor, and boost sales—without drowning in spreadsheets.
What We Deliver
📈 1. Sales Flow Tracker
Visualize your daily revenue patterns—see peak hours, slow stretches, and seasonal surges at a glance. We track sales volume by time of day, product category, and transaction type so you can adjust staffing, run timely promotions, and keep shelves stocked with what sells.
📦 2. Inventory Performance Snapshot
Know what’s moving, what’s stalling, and what’s costing you. We break down product turnover, margin contribution, and reorder frequency to help you streamline purchasing and reduce dead stock.
🧍 3. Customer Visit & Loyalty Signals
Track repeat visits, basket size, and customer feedback. Helps you identify loyal shoppers, spot churn risks, and tailor outreach—whether it’s a thank-you note, a promo code, or a seasonal newsletter.
👥 4. Staffing Efficiency Dashboard
Monitor hours worked, sales per associate, and peak coverage gaps. Helps you balance shifts, reward top performers, and reduce burnout—especially during busy weekends or holiday rushes.
🧾 5. Promotion & Pricing Impact
Measure how discounts, bundles, and seasonal pricing affect sales and margins. We show lift, cannibalization, and timing effects so you can fine-tune your strategy and avoid leaving money on the table.
Whether you’re selling handcrafted goods or managing a multi-department store, your business depends on rhythm, relevance, and relationships. Our dashboards help you stay in sync—tracking sales, inventory, and customer behavior in a way that’s visual, intuitive, and built for action. It’s about spotting patterns, making smart adjustments, and turning everyday data into everyday wins.
📊 Dashboard Overview: Owner Snapshot (sample)
| Metric | Value | Trend vs. Prior Week |
|---|---|---|
| Total Sales | $8,420 | ▲ +12% |
| Avg. Basket Size | $46.80 | ▲ +$3.20 |
| Repeat Customers | 38 | ▼ –5 |
| Top-Selling Category | Local Crafts | — |
Narrative Insight:
Sales rose this week, driven by higher basket sizes and strong performance in local crafts. Repeat visits dipped slightly—consider a mid-month loyalty push or in-store event.
| Date | Transactions | Revenue | Avg. Basket Size |
|---|---|---|---|
| Mon Sep 8 | 42 | $1,890 | $45.00 |
| Tue Sep 9 | 38 | $1,720 | $45.26 |
| Wed Sep 10 | 44 | $2,020 | $45.91 |
| Thu Sep 11 | 40 | $1,800 | $45.00 |
| Fri Sep 12 | 48 | $2,160 | $45.00 |
| Sat Sep 13 | 52 | $2,340 | $45.00 |
| Sun Sep 14 | — | — | — |
Narrative Insight:
Weekend traffic was strong, with Saturday leading in both volume and revenue. Sunday was closed—consider testing a limited hours format or pop-up vendor showcase.
| Alert Type | Description |
|---|---|
| Low Margin Item | Handmade soaps selling well but at 12% margin |
| Stockout Risk | 3 top items below reorder threshold |
| Staffing Gap | No coverage scheduled for Friday 5–7pm |
| Loyalty Opportunity | 5 customers made 3+ purchases this month |
Narrative Insight:
Low-margin items may need bundling or price review. Stockouts could impact weekend sales—check reorder timing. Friday staffing gap is a quick fix. Loyalty signals are ripe for outreach.
- PDF Snapshot – For team huddles or store manager updates
- Excel Export – Full transaction log and inventory data
- Email Digest – Weekly summary sent to owner inbox
- Print-Friendly View – For back office or staff lounge